Options backtests rarely fail loudly. A backtest on bad equity data usually throws up something obviously wrong, such as a return spike no one can explain or a stock trading after its delisting date. Bad options data tends to produce results that look reasonable, perhaps a skew that is slightly too steep or a hedge that bleeds a few basis points a day, and a strategy that looks sound on paper ends up being sized on numbers that were never real.
Part of the reason those numbers go unchallenged is that vendors usually describe historical options data in terms of coverage, meaning years of history, number of underlyings and delivery formats. Coverage is the right place to start, but it says nothing about how the data was built. Two datasets with identical coverage can show different implied volatility for the same contract on the same day, because each vendor made its own decisions about when to sample prices, how to calculate the Greeks, how granular to make the data, how much of the feed to keep and how to handle contracts through their lifecycle, from corporate actions to delistings.
Historical options data vs options market data
Options market data is the umbrella term for trades, quotes, open interest and reference data from the US options exchanges, whether delivered live or after the fact. Historical options data is the archived portion used for backtesting, volatility research and model calibration. This distinction matters because an archive carries obligations a live feed does not. An archive has to stay accurate about contracts that expired years ago, about underlyings that no longer trade and about contract terms that the clearing house rewrote after a merger or special dividend. How well an archive meets those obligations comes down to a handful of choices the vendor made while building it, and the rest of this guide takes those choices in order of how much harm they cause, beginning with the one that affects every row in the file.
Snapshot timing and the options closing price
Every implied volatility, Greek and surface in an end-of-day options dataset depends on the moment at which prices were captured.
Implied volatility is solved from two prices, the option’s and the underlying’s, and the two have to describe the same moment. When they do not, any move in the underlying between the two timestamps is read as a change in volatility. On an at-the-money contract even a small gap shows up clearly in the implied volatility, and because the error runs in opposite directions for calls and puts, it can show up as a skew that the market never priced.
Mismatches usually come from a few familiar sources. The most common is using the last trade as the closing price. Most strikes do not trade every day, so an out-of-the-money contract’s “close” may be hours or days old while the underlying close is current. Session differences add another. Options on broad-based indices and some ETFs trade until 4:15 p.m. ET, fifteen minutes after the equity close, so pairing a 4:15 option quote with a 4:00 underlying price mixes two markets. Some products sidestep the noisy close entirely. Cboe’s end-of-day summary files, for example, also record quotes at 3:45 p.m. ET, because spreads tend to widen into the bell.
Snapshot timing is therefore best treated as an assumption in the model rather than a detail of how the file was produced. A surface built from 3:45 p.m. mid quotes and one built from closing mids are both valid, but a strategy calibrated on one will behave differently when it trades against the other. Some teams plan to get around this by rebuilding implied volatility from raw prices themselves, which only works if the dataset holds intraday quotes for both the option and the underlying with matching timestamps. algoseek’s options minute bars, described in the intraday section below, record both.
Open interest has a timing problem of its own. OCC counts open positions after each session settles, and the figure reaches the market before the next morning’s open, so the number available on any trading day describes positions at the previous day’s close. Vendors differ in which date they file it under. Some stamp it with the day it was published and others with the session it describes. A backtest that filters contracts by open interest under the second convention is using a figure no trader could have seen until the following morning.
For any vendor, the first question is when the option and underlying prices were sampled, and whether they were sampled at the same moment.
Implied volatility and Greeks calculation methodology
Aligned inputs still leave room for disagreement in the pricing model. Two vendors can start from the same quote and publish different deltas without either being wrong, and the clearest source of the difference is exercise style.
Index options such as SPX are European-style and can be priced with the closed-form Black-Scholes-Merton formula, first set out in The Pricing of Options and Corporate Liabilities. US single-stock and ETF options are American-style, and the right to exercise early, which matters most for deep in-the-money puts and for calls ahead of a dividend, is something the closed-form formula cannot capture. Vendors handle it with tree or numerical models, and each produces slightly different values where early exercise is most likely.
Dividends matter beyond early exercise, because the dividend schedule is one of the inputs the option price does not supply, along with the interest rate curve and, on hard-to-borrow names, borrow costs. A vendor that assumes a flat rate or ignores discrete dividends will publish implied volatilities that drift on dividend payers, most visibly around ex-dates. Some vendors reduce this problem by inferring the forward price from the market’s own call and put prices, which builds the market’s view of carry into the calculation, and a buyer should know which approach was used.
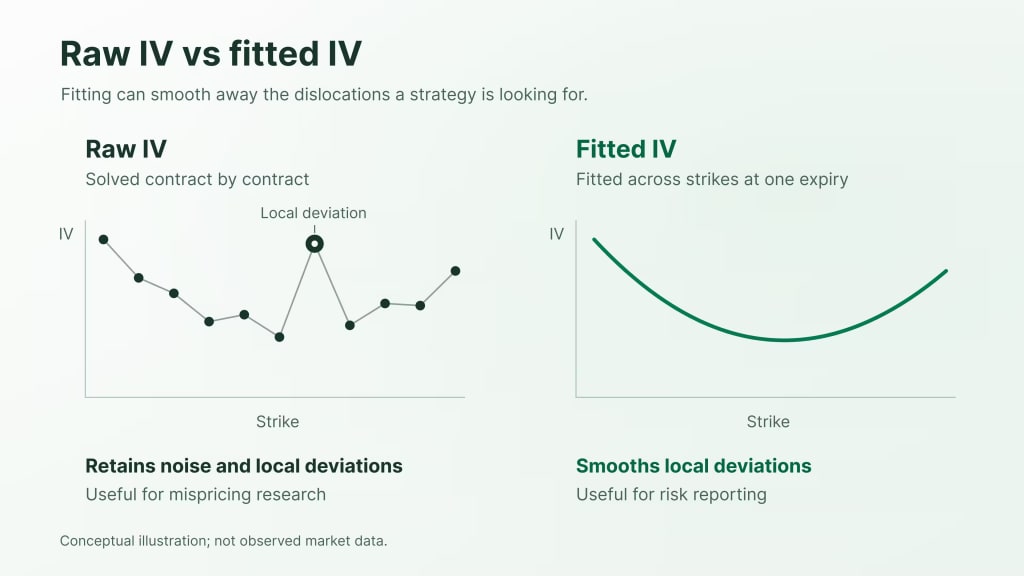
Whatever inputs a vendor chooses, it still has to decide whether to publish the values raw or fitted. Raw implied volatilities are solved contract by contract and carry the noise of wide spreads and stale quotes. Fitted values come from a surface the vendor has calibrated across strikes and expiries, so they are cleaner but carry the vendor’s modelling choices along with the market’s prices. Fitted data works well for risk reporting and poorly for strategies that look for mispricing, because the fitting smooths away the very dislocations those strategies trade.
The documentation for algoseek’s US Options Daily Analytics shows the level of disclosure to expect, naming the model for each exercise style and the price the calculation starts from. Once a team knows the model, the rate and dividend inputs and whether values are raw or fitted, vendor Greeks are perfectly usable, and the team can adjust them wherever its own model differs.
End-of-day vs intraday options data
Choosing too coarse a dataset does real damage, but the damage is usually visible to an attentive reviewer, often as results that look too smooth.
End-of-day options data covers a meaningful share of buy-side research. Volatility risk premium studies on monthly expiries, term-structure work and strategies that rebalance once a day near the close can all be run on a well-built daily snapshot, provided the timing issues above are handled. Daily data is cheaper, lighter and quicker to clean, and for these uses intraday detail mainly adds storage cost.
Intraday data becomes necessary for three reasons. Backtest fills should reflect when the strategy would actually have traded, and a closing price says nothing about 10:30 a.m. Transaction costs in options are dominated by the bid-ask spread, which varies through the session and widens at the open and close, so assuming mid-price fills at the close understates costs for anything that trades at other times. And short-dated contracts, 0DTE above all, move so quickly within the day that one daily observation tells almost nothing about how they behaved.
Minute bars are the usual compromise between daily snapshots and full tick data, and their value depends on what each bar contains. A bar built only from trades inherits the stale-price problem, since most contracts do not trade in most minutes. algoseek’s US Options Trade and Quote Minute Bar shows what quote fields add. Each bar carries roughly 60 fields built from OPRA trades and NBBO quotes, including open, high, low and close for the bid, the ask and trades, the minimum and maximum spread within the minute, and contract volume broken down by where it traded relative to the bid and ask. According to algoseek’s minute bar guide, each bar also records the underlying’s NBBO bid and ask at the millisecond of the bar’s first and last option event. Those fields let a backtest make realistic fill assumptions and rebuild a volatility surface without the cost of storing every message.

OPRA data vs exchange direct feeds
US listed options trades and top-of-book quotes from every exchange are consolidated by the Options Price Reporting Authority, or OPRA. Nearly all historical options data is derived from OPRA, and the products built on it differ in how each vendor captured and processed the feed.
OPRA is a top-of-book feed. It carries each exchange’s best bid and offer, the national best bid and offer (NBBO) and trade reports, but not the depth of orders behind the best prices. Depth is available only from each exchange’s proprietary feed, which is why research into order book dynamics or market-maker behaviour needs direct exchange data. For backtesting, valuation and volatility work, top of book is generally sufficient, and the cost of direct feeds is hard to justify. Some products narrow the feed further on purpose. algoseek’s US Options Trade and NBBO Quote dataset states up front that its quote stream is limited to the NBBO, a sensible choice for execution analysis as long as the buyer knows it was made.
The bigger differences come from what each vendor keeps. OPRA’s message volume is large enough that storing it without loss takes serious infrastructure, and some vendors conflate the feed, keeping only the last quote in each interval and dropping the updates in between. That matters for any analysis of how quotes move. Trade condition codes are the other dividing line. Multi-leg orders, late reports and cancellations all appear in the trade stream with condition codes, and a spread trade can print outside the single-leg NBBO because it was priced as a package. If those prints feed into a dataset’s high and low without being flagged, the data shows prices no single-leg order could have achieved. Before buying, a team needs to find out whether the vendor captured the full feed or a conflated one, whether individual exchange quotes are kept alongside the NBBO, and whether condition codes are preserved with a stated rule for which ones are excluded from bars.
Options contract adjustments and survivorship bias
Corporate actions come last because they touch a small share of contracts, but when they go wrong the errors are large and tend to land on exactly the names that event-driven strategies care about.
When an underlying splits in an uneven ratio, pays a special dividend, spins off a business or is acquired, the Options Clearing Corporation (OCC) adjusts existing contracts so that holders are neither helped nor hurt by the event, and publishes the terms of each adjustment in an information memo. Whole-number splits are straightforward, with strikes divided and contract counts multiplied. Uneven splits, reverse splits that leave a fraction of a share, special dividends and mergers change the deliverable itself, so a contract may come to represent 150 shares, or shares plus cash, or shares in two companies, and it typically trades under the original option root with a numeral appended.
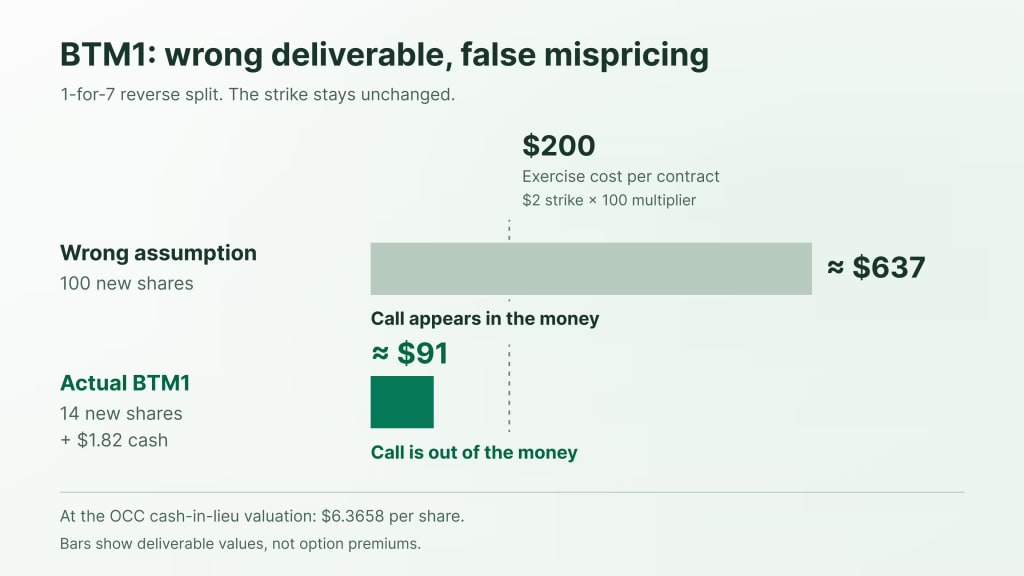
Bitcoin Depot shows how this plays out. The company completed a one-for-seven reverse split before the open on February 23, 2026, and OCC Information Memo #58385 set out the adjustment. The option symbol changed from BTM to BTM1, strikes were left unchanged, and each contract, which had delivered 100 shares, now delivered 14 new shares plus cash in lieu of the remaining 0.2857 of a share. OCC’s cash-in-lieu memo #58507 later fixed that cash at $1.82 per contract, valuing the fraction at $6.3658 a share. At that price each adjusted contract delivered about $91 of value, against $637 for 100 shares. Because strikes were not changed, any BTM1 call struck between roughly $0.91 and $6.37 was genuinely out of the money, yet a backtest that prices it as a standard 100-share contract sees it in the money. At a $2 strike, for instance, the aggregate strike is $200, so the call is worth very little against a $91 deliverable, but the 100-share calculation shows it $4.37 a share in the money and trading near zero. The matching put, genuinely worth about $1.09 a share, appears to trade far above an intrinsic value of zero. Both apparent opportunities come entirely from the wrong deliverable, and a dataset that carries an adjusted contract’s prices without its new terms will compute implied volatility and Greeks that are wrong by the same margin.
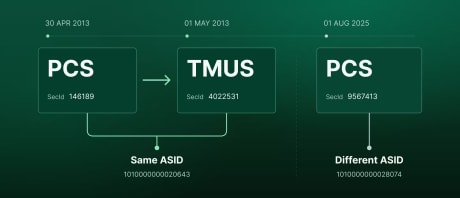
Survivorship bias is the second lifecycle risk. Options expire continuously, and underlyings are acquired, renamed or delisted. An archive assembled by starting from today’s listed names and filling in their history will be missing every contract on every underlying that has since disappeared, so the safeguard is a reference catalog that keeps delisted roots. algoseek’s US Options Security Master covers listed and delisted option roots and assigns each one an identifier that holds steady as individual contracts list and expire. A volatility strategy tested only on survivors has never been through a takeover, a bankruptcy or a delisting, the events where option books typically take their worst losses, so its risk profile looks better than it is.
How to test a historical options data sample before buying
Most of the issues above show up in a vendor sample within an afternoon, without building any models.
- Recompute implied volatility for twenty or thirty contracts using the vendor’s own inputs and any standard options pricing library. Close agreement confirms the methodology matches the documentation, while gaps that cluster around ex-dividend dates usually point to a different dividend treatment.
- Measure staleness on a liquid underlying. Count how many closing prices are trades more than an hour old, how many strikes near the money show a zero bid and how many quotes anywhere show a bid above the ask. A zero bid on a far out-of-the-money strike is a genuine quote, but near the money it points to a data problem.
- Check put-call parity on index options at the vendor’s snapshot time. For European-style options, the call price minus the put price at the same strike and expiry equals the discounted forward minus the discounted strike, so every strike pair implies a forward price. Back out that forward for each strike in a single expiry. In clean data the implied forwards sit almost on top of one another and, once interest and dividends are allowed for, line up with the recorded underlying price. Forwards that agree with each other but not with the underlying point to an underlying captured at a different moment from the options, while forwards that scatter as strikes move away from the money point to stale or one-sided option quotes.
- Trace a single corporate action through the sample. Choose an underlying that went through an uneven or reverse split or a special dividend, find the adjusted contracts and confirm that the new deliverable and multiplier sit alongside the prices and match OCC’s memo for the event.
- Request contracts on an underlying that was acquired or delisted several years ago. A vendor that cannot supply them built its archive from today’s survivors.
Choosing a historical options data vendor
A dataset’s coverage shows only which contracts are included. Whether two datasets with identical coverage actually match depends on five methodology choices, which are when prices were sampled, which model produced the Greeks, how granular the data is, how much of the OPRA feed was kept and how contracts were handled through adjustments and delistings. When a vendor is open about those choices and its sample passes the tests above, a team can trust that its backtest is running on the data it thinks it is.
The views, analysis and figures are the author’s own and do not necessarily reflect those of algoseek. This content is for educational purposes only and is not investment advice.