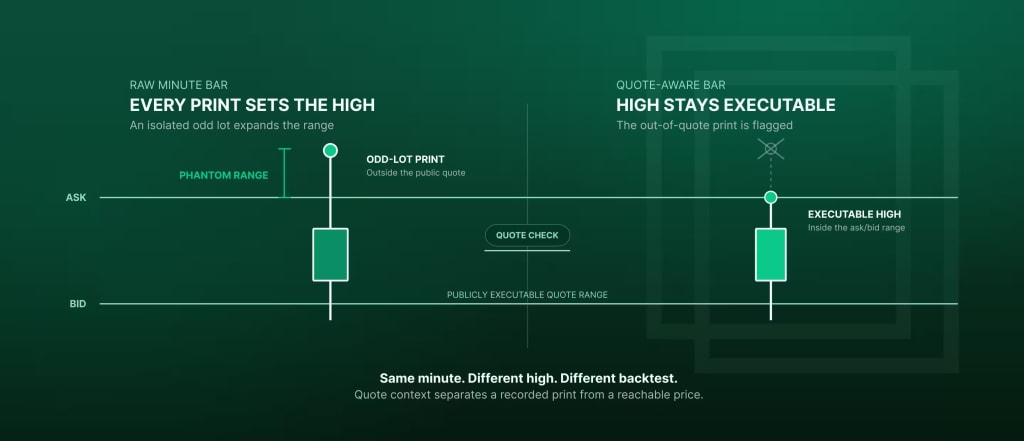
Every intraday backtest begins by turning a stream of trades into OHLC bars, where the high and low of each minute are simply the highest and the lowest trade that printed. That looks like the one step too mechanical to get wrong, and that is exactly where the error hides. A print on the tape records that a transaction happened, not that an order could have reached that price. The US tape is full of trades at prices no ordinary order could ever have touched.
When one of those prints lands above the highest price a buyer could actually have paid, or below the lowest a seller could actually have taken, the bar stretches to swallow it. The high or low your strategy trades against then becomes a price that was never really for sale.
A breakout that fires when price crosses the high is now triggering on a level no order could have hit. The same holds for a stop-loss resting under the low, which gets knocked out by a low no order could have hit, even while the bar looks perfectly normal and the number genuinely printed.
Where the phantom prices come from
Three kinds of trade are responsible, and the biggest by far is the odd lot, meaning any trade smaller than 100 shares, or, since the SEC’s market data infrastructure rule began phasing in round lots tiered by price of 100, 40, 10 or a single share through November 2025, anything below the round lot for the band a stock trades in. Odd lots escape Reg NMS, the rule that pushes the best-priced quotes to the front of the market and protects them from being traded through, so an odd lot is free to print well inside or outside the public quote, at a level no round-lot order could have matched. Their history explains the scale: banned from the consolidated tape (SIP) until December 2013, they have since grown into a majority of all trades by count, concentrated in high-priced names where a single round lot is expensive enough that most activity happens in smaller pieces.
Off-exchange trades are the second kind, and they never touch a public exchange at all, accounting for close to half of US volume and for more than half in recent months. Most are filled inside a dark pool or, more often, at a wholesaler that has paid a broker for its retail order flow under payment for order flow and then internalized the order itself, before reporting the trade to a FINRA facility, where it reaches the tape under the exchange code “D”. A trade like that was never exposed to the public market, so it can sit outside the national best bid and offer for three legitimate reasons: it does not have to match the public quote, it can arrive up to ten seconds late at a price the market has already left behind or it was priced off a benchmark formula rather than the live market.
Condition-coded trades are the third kind, each carrying an explicit flag on the tape that its price was something other than the live market: an average of many fills, a price agreed at an earlier reference time or a value derived from another instrument.
The exchanges are well aware of all this, and their own rules specify, condition by condition, which trades may set the official high, low and last. Odd lots, most off-exchange prints and condition-coded trades are all ruled out, so the published high and low already exclude them. The trouble is that most desks never touch those published figures, because they pull the raw stream of individual trades and build their own bars with a plain maximum and minimum, which quietly reinstates every print the exchange had removed.
Whichever print causes it, the error runs in only one direction. A clean bar is built from a subset of the very same trades, so its high can only sit at or below the raw high while its low sits at or above the raw low, which means the phantom range between them,
phantom_range = (raw_high - clean_high) + (clean_low - raw_low) >= 0
is never negative on any bar. Cleaning pulls a wick inward and never pushes it out, and that one-directional property is what makes the effect a genuine bias rather than noise that would average away over a long enough backtest.
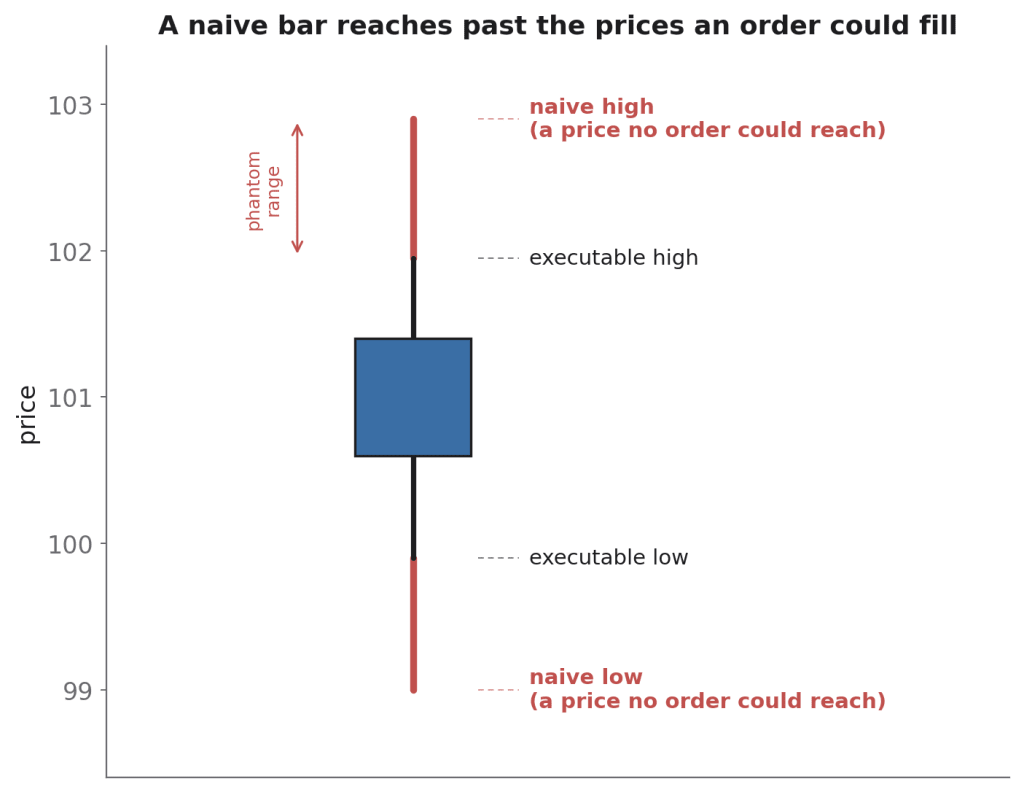
Figure 1: A single one-minute bar. The black wick is the clean bar, built only from trades an order could have reached, while the red extensions are phantom prints, an odd lot or a late off-exchange report, that a plain high-and-low folds into the bar. Only the extremes move, and the extremes are exactly what a breakout or a stop trades against.
Building clean bars from tick data
Correcting this is nothing more than a filter applied before the high and low are taken, and because it reads only what is already stamped on each trade, it never looks into the future. One bar keeps every print, while the other keeps only the trades a real order could have reached.
# Raw bar: highest and lowest of every trade in the minute.
raw_high = prints["price"].max()
raw_low  = prints["price"].min()

# Clean bar: keep only trades a marketable order could have reached, which
# is the subset that printed at or inside the prevailing NBBO. Anything that
# landed away from the quote falls out on that one flag, whether it was an
# odd lot, a condition-coded print or a late off-exchange ("D") report, and
# the off-exchange fills that did land at the quote stay in because a real
# order could have matched them.
reachable = prints["at_nbbo"]
clean_high = prints.loc[reachable, "price"].max()
clean_low  = prints.loc[reachable, "price"].min()
Because the clean bar keeps only a strict subset of the trades, its high and low always fall inside the raw ones without ever reaching into future data, so a feed that already flags which trades executed at the NBBO carries the whole recipe in that one condition.
How often odd lots move the high or low
The figures that follow are measured on Algoseek’s tick-level US equity trades, across the 998 names that make up the top 1,000 US stocks by dollar volume, with the headline covering the odd-lot era from 2014 to 2026 and its 1.01 billion one-minute bars, whereas the year-by-year view reaches back over the full 2007 to 2026 tape where the pre-odd-lot years matter.
Across that universe the share of one-minute bars whose high or low shifts the moment the untradeable prints come out is 59%, rising to 90% on the most recent data, on a sample far too large for that to be an artifact. Measured over the whole tape back to 2007 the figure is 42%, dragged down by the years when odd lots were not disseminated at all. Split by cause, odd lots account for 76% of the effect and off-exchange prints for a further 18%, so almost the entire distortion comes from the two things a plain maximum and minimum are blind to.
This damage is not spread evenly. High-priced stocks are struck most often, because a round lot of a $500 name costs enough that trading fragments into odd lots, and more than nine bars in ten there carry a phantom high or low. Cheap stocks are struck hardest on size instead, because a fixed sub-penny displacement is a far larger fraction of a low price, so on sub-$5 names the typical phantom bar is stretched by around 15 basis points.
By far the strongest evidence that this is a real mechanism rather than a data glitch is a change the tape made in December 2013. Odd-lot executions were not disseminated to the consolidated tape at all before the ninth of that month, and almost no bars were affected until then, whereas the day odd lots began printing the affected share jumped, reached 30% within a year and has climbed with the odd-lot share of volume ever since, up to 90% by 2026.
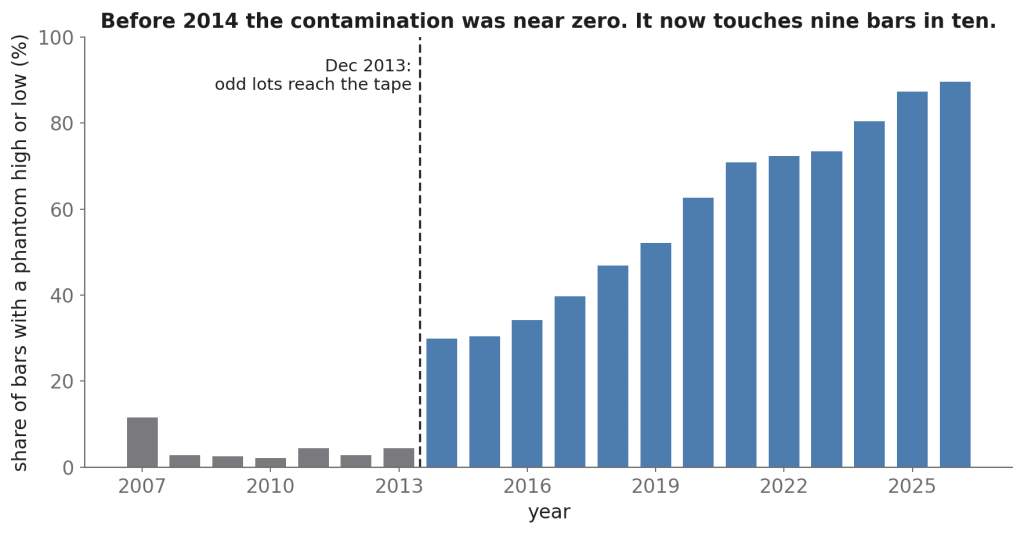
Figure 2: The share of one-minute bars whose high or low shifts once the untradeable prints are removed, by year and across the top 1,000 US stocks. It starts near zero, switches on with the December 2013 odd-lot tape change and climbs with the odd-lot share of volume until a backtest on recent data is affected on almost every bar.
The real danger is that it scrambles your ranking
The natural assumption is that a wider bar simply flatters a backtest, so cleaning would only shave a little optimism off the top. That assumption is wrong, and the reason it is wrong is the whole point.
Phantom highs and phantom lows push a strategy in opposite directions. A breakout that triggers on a phantom high books a win the market never offered, so the strategy looks better than it is, whereas a stop-loss resting just above a phantom-depressed low is knocked out for a loss the market never offered, so the strategy looks worse than it is. Which way any single strategy moves therefore comes down to its own stop and target rules, and across 7,232 costed strategies the phantom prints flatter 85% of them and hurt the other 15%.
Because the shift differs from one strategy to the next, it does not lift the whole field by a common amount but reshuffles it. That reshuffling breaks the one step every research process depends on: ranking a pool of candidates by their in-sample results and keeping the best of them. Once that ranking is scrambled by prices nobody could have traded, the strategies that get promoted are no longer the ones that will survive on real fills, and a uniform layer of optimism could be subtracted back off, whereas a scrambled ranking cannot, because it corrupts the comparison itself.
What it costs, and the fix
The cost shows up when two identical research pipelines are run side by side, differing only in the bars they select on, one on raw bars and the other on clean, then scored on the fills a real order would have received: selecting on clean bars ranks strategies measurably closer to their live outcome. In an edge-free universe the gap is modest, because a persistent cost signature dominates the ranking, yet it is real, it survives once the strategies are counted at their true correlated breadth and it always points the same way. Translated into deployment terms, that gap runs to between $30,000 and $165,000 a year on a $100 million book at 10% target volatility, present whether or not the strategy carries any genuine edge.
Fixing it costs nothing and adds no risk of look-ahead, because the filter reads only what is already written on each trade. Keep only the prints that executed at or inside the prevailing quote and take the high and low of what remains, which sheds the odd lots, the condition-coded trades and the off-exchange reports that landed away from the market while retaining the off-exchange fills a real order could have matched. Where a feed already marks trades at the NBBO, as Algoseek’s US equity data does alongside the sale-condition codes, the whole thing is a single flag, so that the high your strategy trades against is always a price someone could actually have paid.
What this is not
None of this means the exchange’s official high and low are wrong, since they already exclude these prints, and a desk that consumes a vendor’s NBBO-eligible bar rather than building its own is largely protected, whereas a vendor’s plain trade bar usually carries every odd lot and off-exchange print straight into the high and low, so the exposure sits with the raw trade stream and with any bar that aggregates it unfiltered.
Nor does cleaning manufacture profit. A clean bar is still wider than the round-trippable price by the width of the bid-ask spread, which no condition filter removes, and the universe tested here has no real edge to begin with, so nothing turns a losing strategy into a winning one. What cleaning does buy is a ranking that can be trusted, one that sorts strategies by what they would truly do on tradeable prices instead of prices that were never for sale, and in research that ranking is most of the game.
One working paper to follow lays out the full study, including the formal proof behind the two-sided effect and the ranking test run across the entire US market.
The views, analysis and figures are the author’s own and do not necessarily reflect those of algoseek. This content is for educational purposes only and is not investment advice.


